Your customer should never be the one who tells you the site is down.
Uptime, SSL, and server monitoring in one flat-priced dashboard, so you know the second anything breaks. Everything the big tools charge a fortune for, at a price built for MSPs, home labs, and small teams.
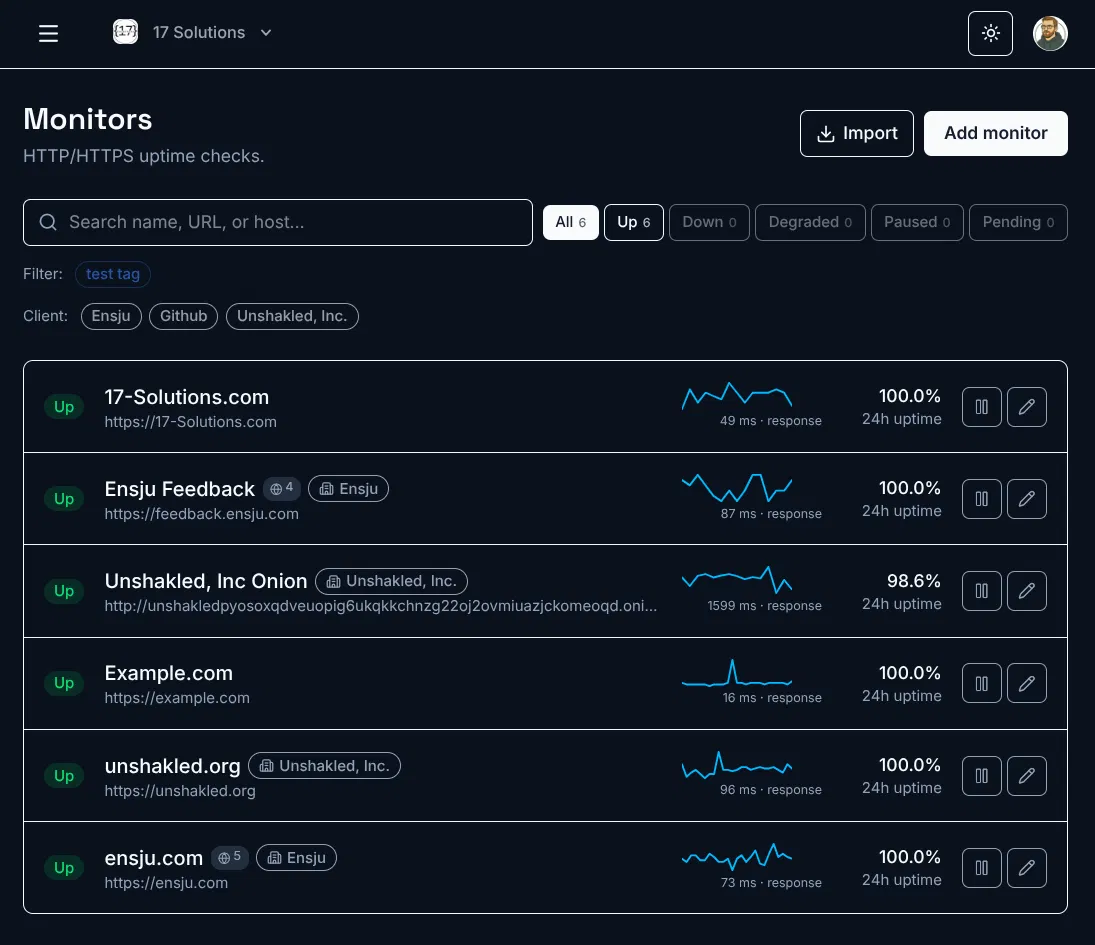
Enterprise monitoring. Without the enterprise invoice.
Datadog, Pingdom, and the rest meter you per host, per check, and per seat. Great math for a bank. Punishing for a home lab, an MSP watching dozens of client sites, or a team of five. Ensju is flat-priced and generous: the monitoring that matters, at a price that makes sense.
Flat monthly plans
No per-host or per-check metering. Your bill never surprises you.
A genuinely free tier
Ten monitors, forever. No trial countdown, no card.
Every channel, every plan
Slack, Discord, Telegram, Signal and webhooks aren't an upsell.
One dashboard for everything you run
Your sites, your certificates, and the servers behind them, watched around the clock.
Website, API & .onion uptime
HTTP, TCP, DNS, ICMP, plus Tor .onion. Checks as fast as every 30 seconds, with keyword and status-code matching.
SSL certificate alerts
Every HTTPS monitor tracks cert expiry automatically. Get warned weeks out, never caught by a lapsed cert again.
Server & infrastructure metrics
A tiny agent reports CPU, memory, disk, network, and load. Outbound-only, works behind NAT and firewalls, no ports to open.
Alerts that reach you
Email, Slack, Discord, Telegram, Signal, and webhooks, routed per monitor to the people who need them.
Multi-region probing
Watch each monitor from up to 5 regions at once. A smart down-rule tells a real outage from a regional blip, so you're not woken for nothing.
Public status pages
A polished status page out of the box, or your own domain. Uptime history, incidents, maintenance, and email subscribers included.
A dashboard that's live
Lists, details, and charts update in real time. No refreshing, no wondering whether what you're looking at is current.
Mobile companion app (coming soon)
View-only iOS + Android apps on the same account, your stuff's status in your pocket. The dashboard already shines on mobile in the meantime.
Ask your AI assistant
Connect Claude, ChatGPT, or Cursor over MCP and ask "is anything down" or "which server is low on disk". Read-only, signed in as you, on every paid plan.
See it in action
Not a mockup. This is the actual dashboard you get on day one, live-updating and dark by default.
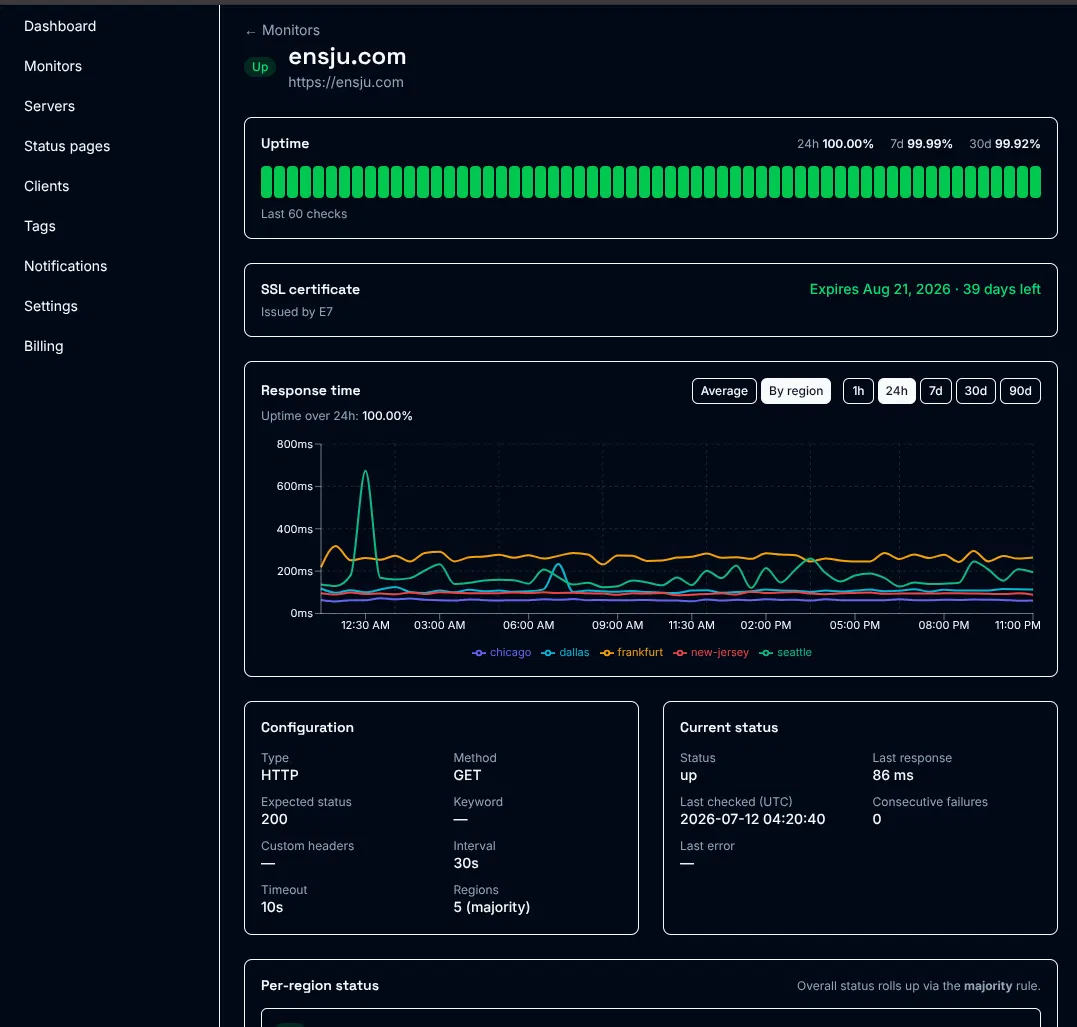
Every check, in depth
Open any monitor for the full picture: uptime across 24 hours, 7 and 30 days, the SSL certificate counting down to expiry, and response time plotted per region. A majority-rule roll-up tells a real outage from a single flaky path.
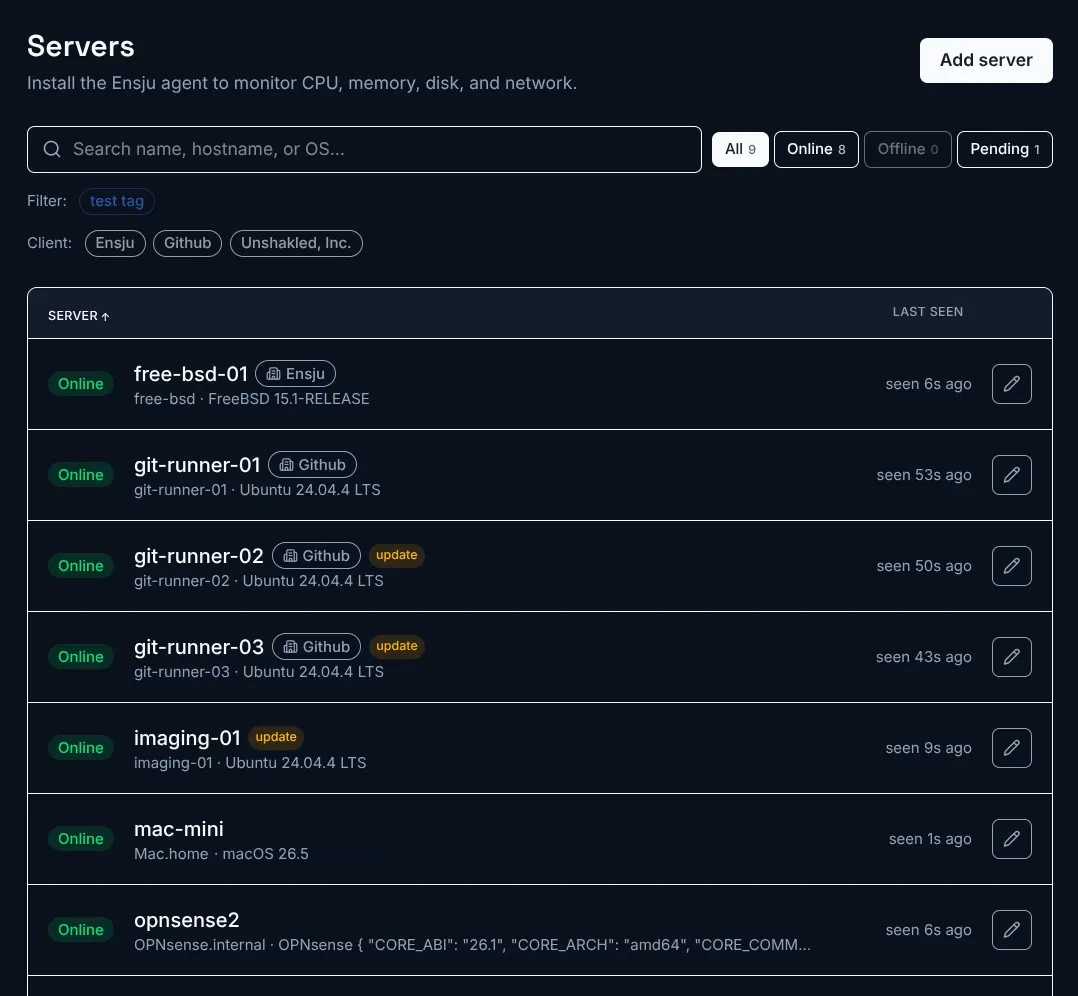
One agent. Every box.
Ubuntu, FreeBSD, macOS, OPNsense — one lightweight agent watches them all. Group and filter by client or environment, and see at a glance which hosts are online, which need attention, and which are due an update.
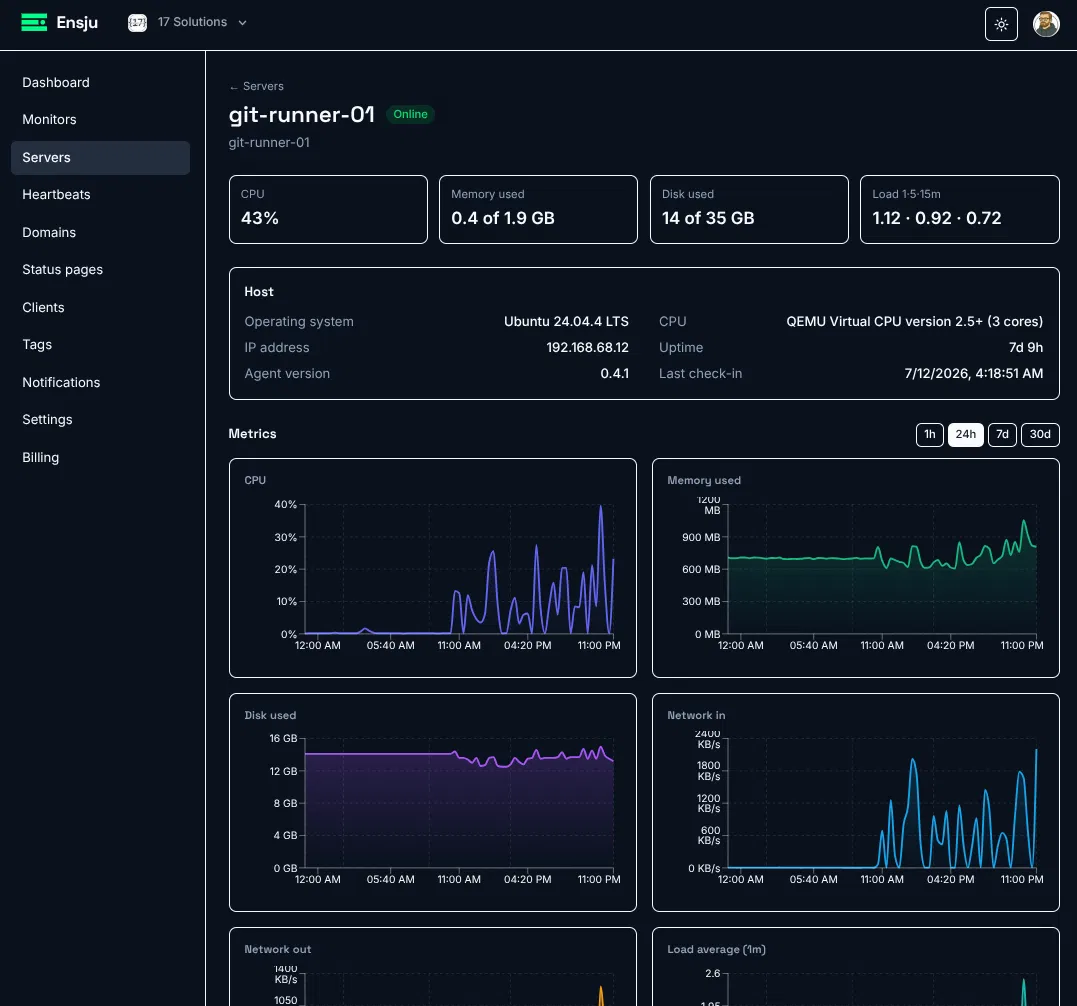
Infrastructure metrics, at a glance
CPU, memory, disk, network, and load — live tiles over trend charts, plus host facts and service health. The agent is outbound-only, so it reports from behind NAT and strict firewalls with no ports to open.
Your dashboard, in your pocket
The Ensju companion app puts every monitor, server, and alert on your phone — view-only, on the same account. The web dashboard already shines on mobile in the meantime.
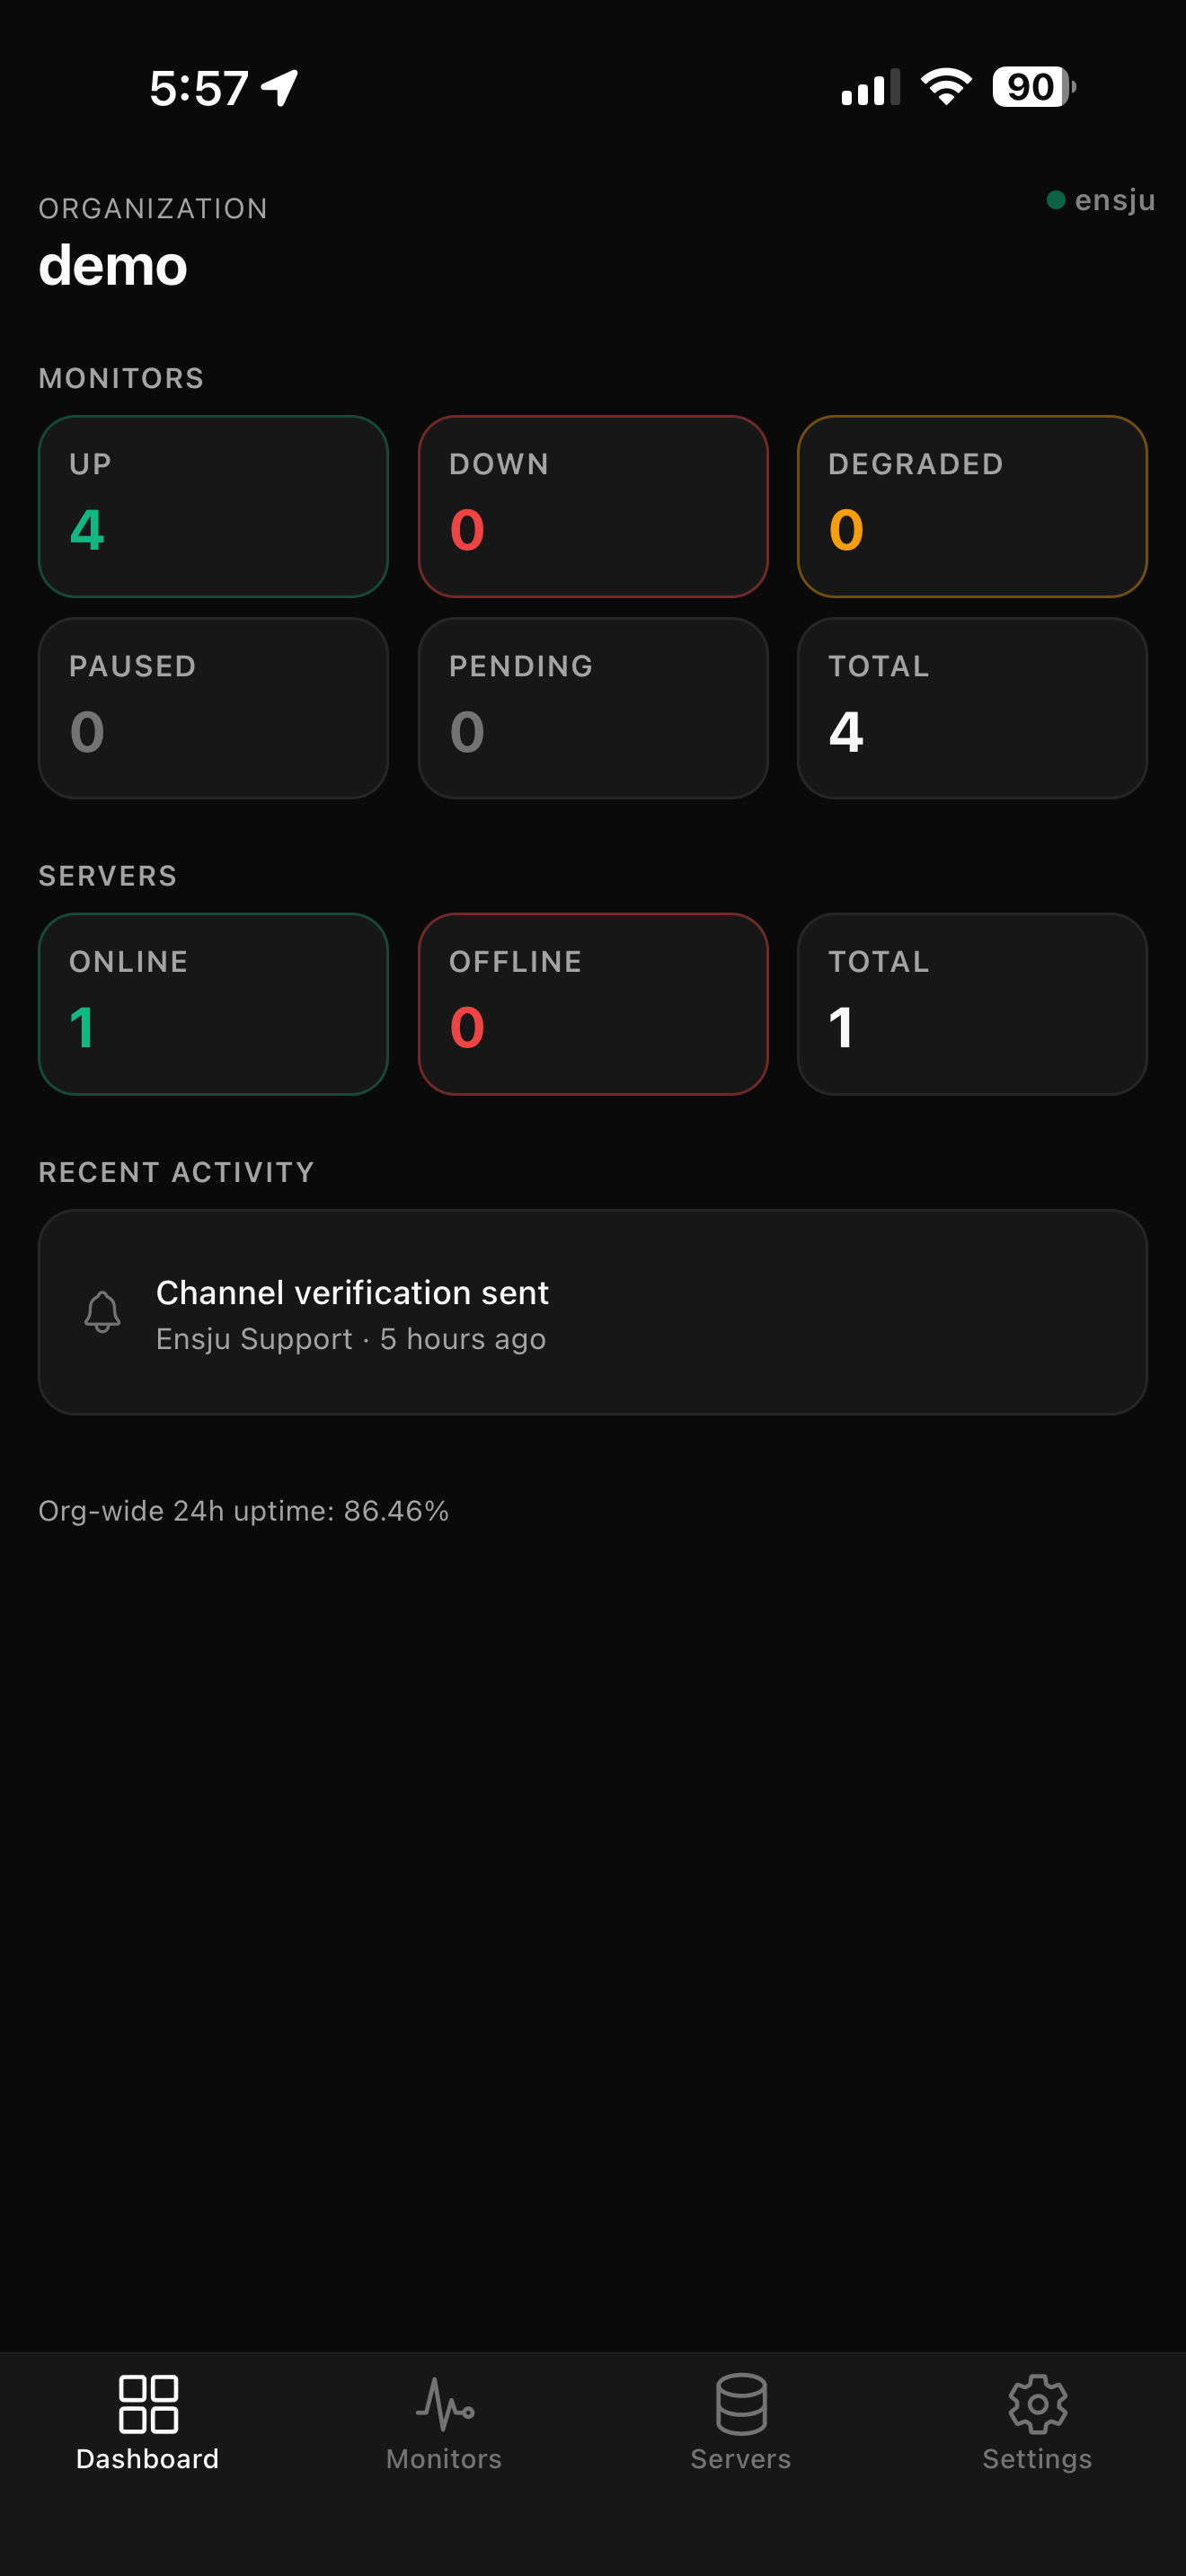
Every org at a glance
Up, down, and degraded counts, servers online, and recent activity — the whole account in one glance.
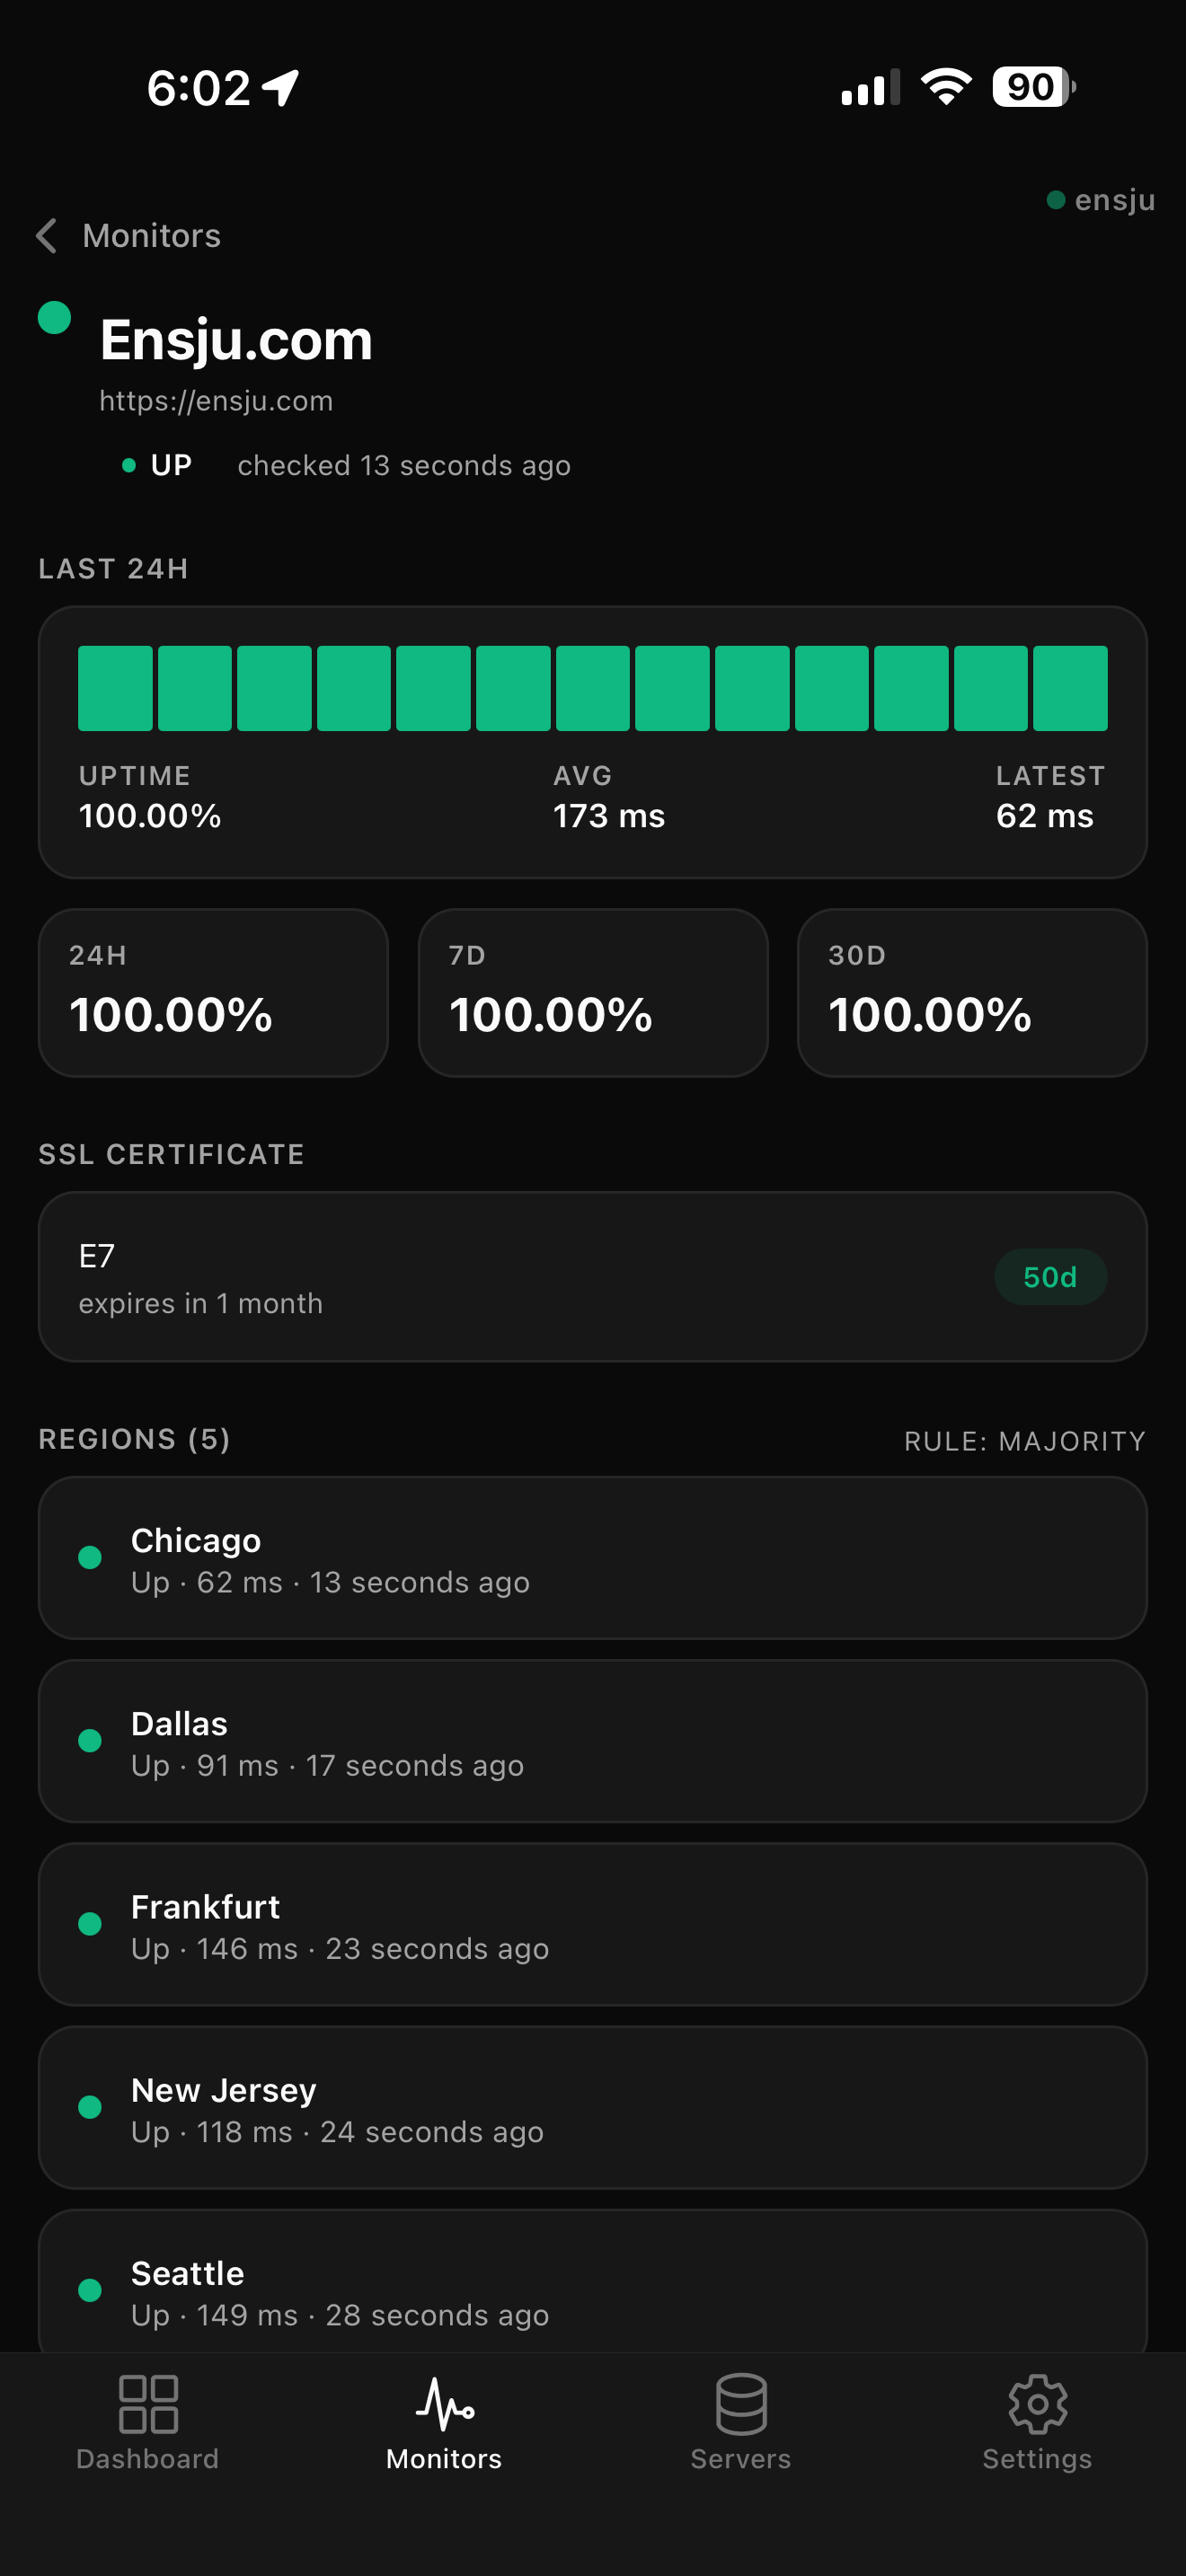
Drill into any monitor
Uptime history, the SSL expiry countdown, and all five probe regions — in the palm of your hand.
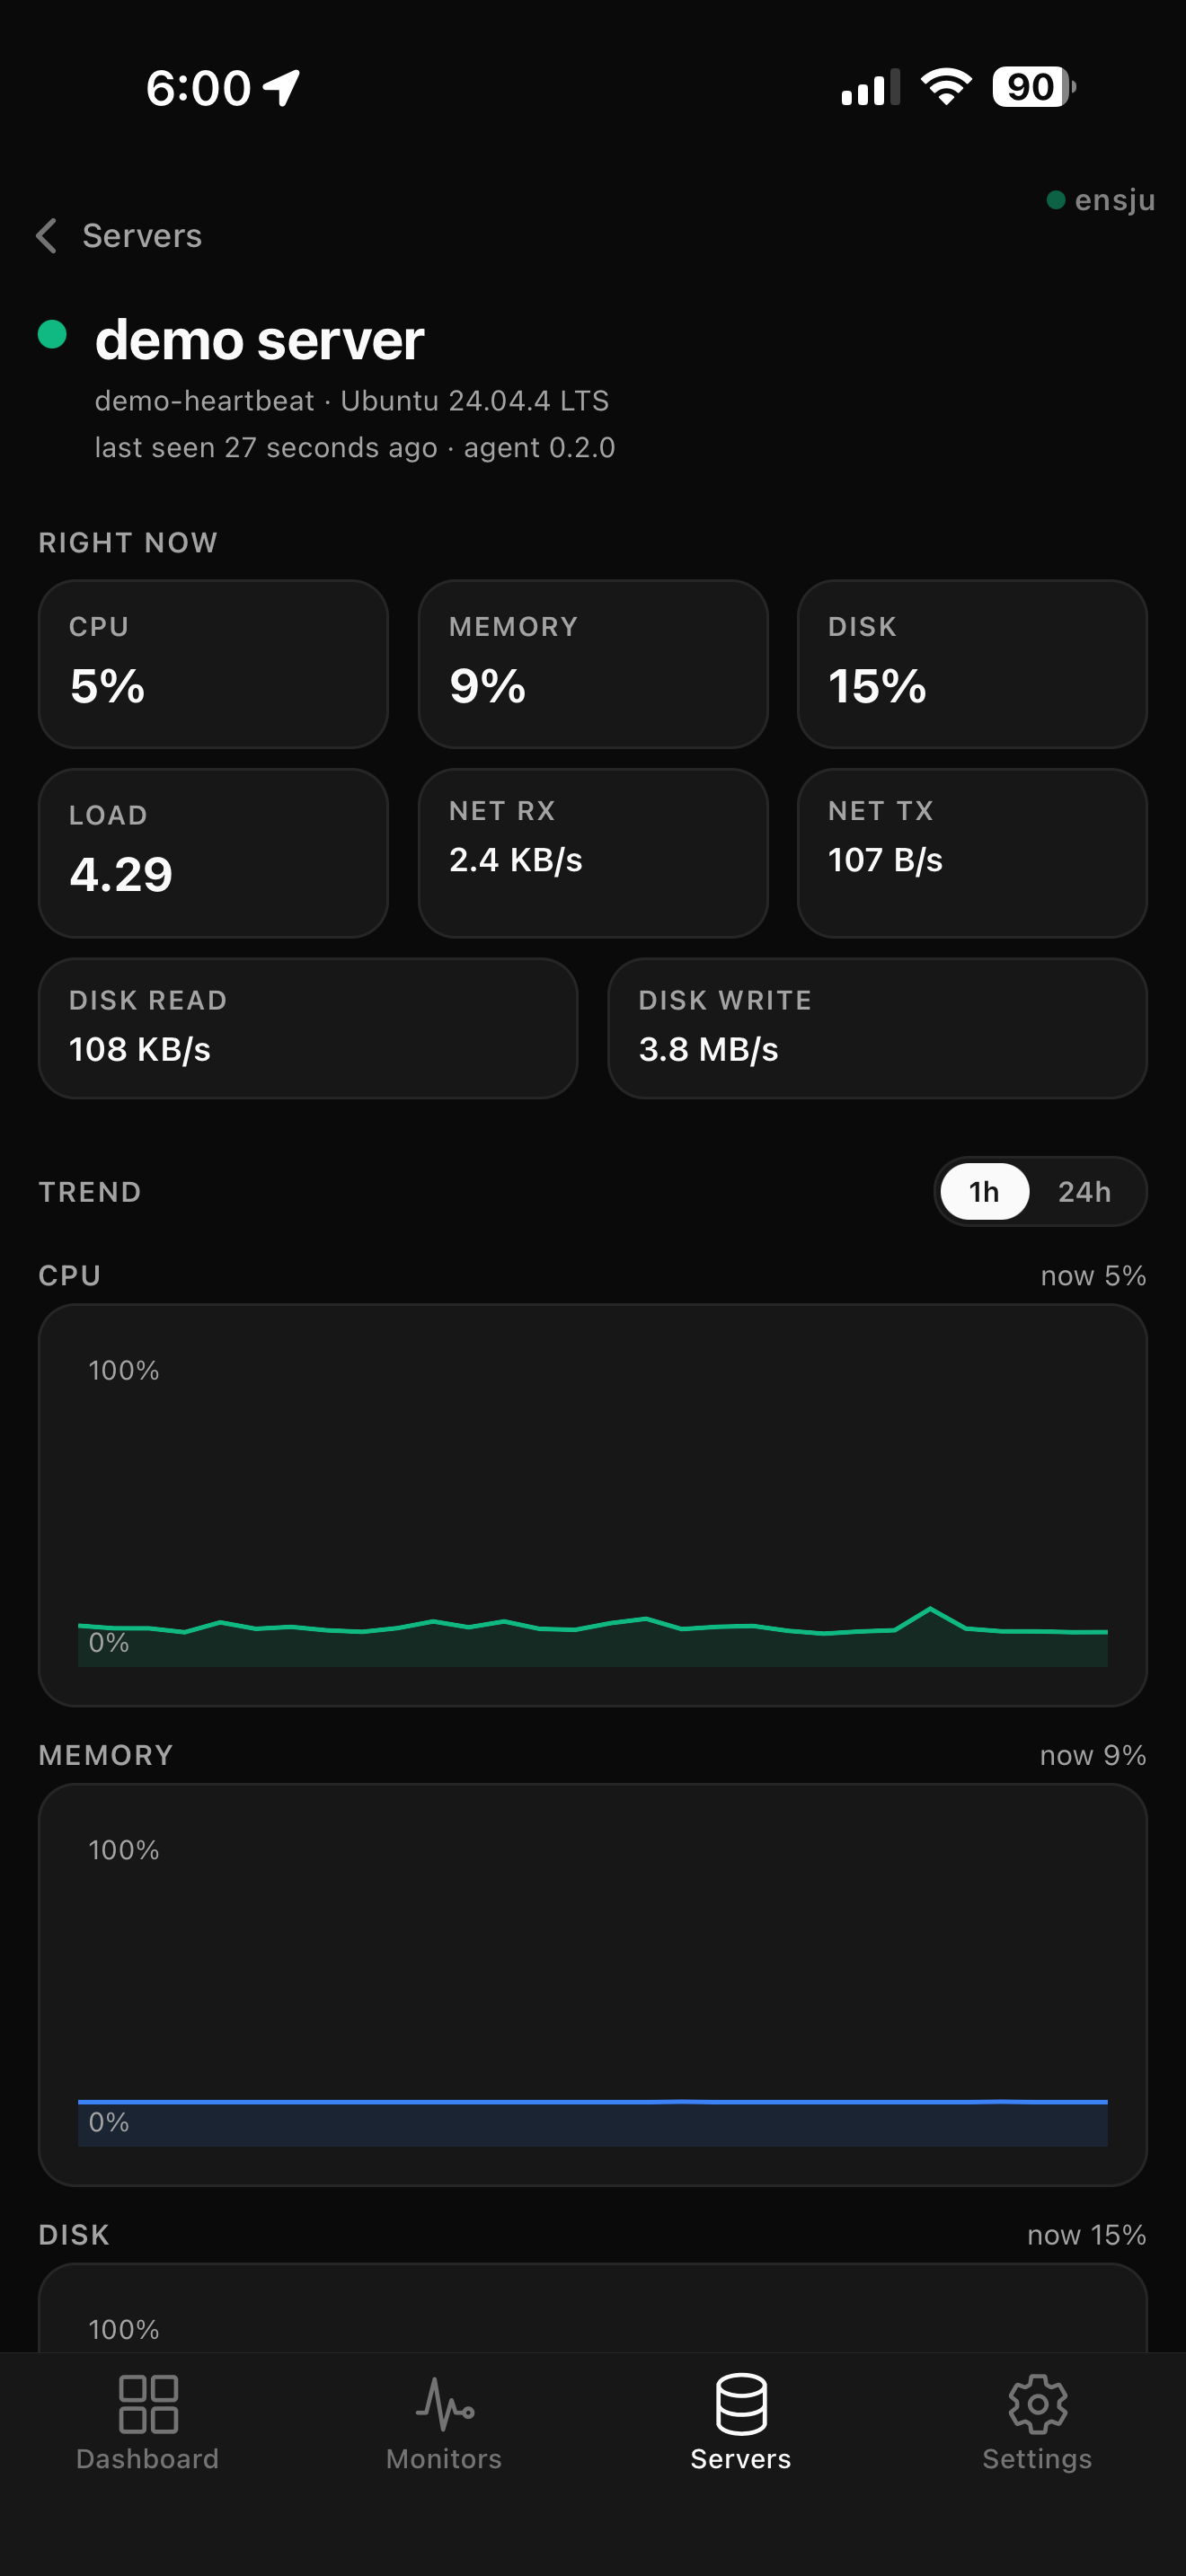
Server metrics, live
CPU, memory, disk, network, and load, with trend charts that refresh as you watch.
Your infrastructure is nobody's business but yours
Monitoring means handing a tool a map of everything you run. We treat that map the way you'd want us to.
We monitor it. We don't monetize it
Funded by subscriptions, not ads. Your monitors, metrics, and logs are never sold, profiled, or fed to an ad network.
Credentials encrypted with AES-256
The secrets you hand us (Slack tokens, webhook URLs) are encrypted at rest, never sitting in a plain database column.
Encrypted in transit
Every connection runs over TLS. Nothing about your stack crosses the public internet in the clear.
The agent calls out, never in
Outbound calls only. No inbound ports, no port forwarding, no VPN. It watches servers behind NAT or a strict firewall, runs unprivileged, and uninstalls in one command.
Want the longer answer: probes, the agent, the dispatch pipeline, the architecture diagram? How Ensju works →
Made for the rest of us
If the big platforms quoted you a number that made you laugh, Ensju is for you.
MSPs & IT consultants
Turn monitoring into a profit line: win clients with it, resell it at 95%+ margin, and prove the uptime you're paid to deliver.
See Ensju for MSPs →
Small businesses & startups
Know before your customers do, without hiring a dedicated SRE.
Home labs & self-hosters
Keep an eye on everything in the rack without signing up for a corporate budget.
Indie devs & makers
Ship it, then sleep. Ensju keeps watch while you build the next thing.
Who's behind it
Built by an MSP, for the clients it already monitors
Ensju is built by Robby, 26 years in enterprise IT, up to tech operations director at a Fortune 50 retailer spanning 8,000+ locations. He runs his own MSP, 17 Solutions, and builds monitoring for people who don’t trust the cloud: run on infrastructure he owns down to the BGP announcement, reachable over Tor, never mined.
Built for the privacy-first crowd
Yes, we monitor your Tor .onion services
Point Ensju at a Tor hidden service and it's checked over Tor like any other monitor (uptime, response time, alerts) with no proxy to run yourself. The big platforms can't reach onion services at all. We connect as a Tor client only (never a relay or exit node), so your .onion lives on the same dashboard as everything else.
Switching from another tool?
We've outgrown "cheapest pinger." See how Ensju's breadth, flat pricing, and privacy stack up: honest tables, real numbers.
Everything's included. Here's the list.
No feature is held hostage in a higher tier. Plans differ by how much you monitor and how often, never by what you're allowed to do.
Free
$0/mo
10 uptime monitors · 1 server agent · 7-day history
Homelab
$10/mo
25 uptime monitors · 5 server agents · 30-day history
Pro
$40/mo
100 uptime monitors · 25 server agents · 90-day history
The no-risk guarantee
30 days. Money back. No interrogation.
Run any paid plan for a full month. If Ensju isn't earning its keep, reply to any email from us and we'll refund every cent. No forms to fill out, no exit interview, no hard feelings. And you can start on the free plan, so you don't even have to take our word for it first.
Common questions
- Is there really a free plan, or is it a trial?
- A real free plan, forever. Ten monitors, one server, 7 days of history, and alerts, no credit card and no countdown. Plenty of home labs and side projects never need to pay a cent.
- I'm an MSP — can I resell Ensju to my clients?
- Yes — that's the model we lead with. The MSP plan is $125/mo for up to 500 monitors, 50 client status pages on your own domains, and 100 server agents. Across 40 clients that's about $3 per client, and MSPs commonly productize monitoring and reporting at $99-299 per client per month. The full per-client math is on our MSP page. See Ensju for MSPs →
- How is Ensju cheaper than Datadog or Pingdom?
- Those tools meter you per host, per check, and per seat, predictable for an enterprise, brutal for everyone smaller. Ensju charges one flat monthly price. The same monitoring, a bill you can actually predict.
- Is there a money-back guarantee?
- Yes. Every paid plan is covered by a 30-day money-back guarantee. If Ensju isn't earning its keep, reply to any email from us and we refund every cent, no forms, no exit interview.
- Do you sell or mine my data?
- Never. Ensju is funded by subscriptions, not advertising. Your monitors, metrics, and logs are yours, never sold, never profiled, never handed to an ad network. Channel credentials are encrypted with AES-256.
- What can Ensju monitor?
- Websites and APIs over HTTP, TCP, DNS, and ICMP; Tor .onion services; SSL/TLS certificate expiry; and full server metrics (CPU, memory, disk, network, load, and service health) via a lightweight agent.
- Can I ask Claude or ChatGPT about my monitors?
- Yes. Ensju has a built-in MCP server, so Claude, ChatGPT, Cursor, or any MCP-capable assistant can answer questions like "is anything down right now" or "what was the uptime of api.example.com this month" using your own Ensju sign-in. It is read-only and included on every paid plan.
- Can you monitor Tor (.onion) services?
- Yes, and almost no other monitoring service can. Add a .onion URL as an HTTP monitor and Ensju checks it over the Tor network, with the same uptime and response-time tracking as any other monitor. There is no proxy to run on your side, and we connect as a Tor client only, never a relay or exit node.
- How long does setup take?
- Minutes. Paste a URL for uptime and SSL checks, or run one command to add a server. No YAML to write, no collectors to babysit, no onboarding call.
- Do I need to open a firewall port?
- No. The server agent only makes outbound HTTPS calls. It never accepts inbound connections, so it works behind NAT, CGNAT, and strict firewalls with zero configuration. Uptime checks run from our side against your public URLs; nothing ever needs to reach into your network.
- Why is it called "Ensju"?
- Ensju is Swedish (en sju, literally "one seven", or 17), a nod to our Swedish roots and to 17 Solutions, the company behind Ensju. Say it "en-SHOO": the sju uses the distinctive Swedish "sj"-sound, a soft rush of air somewhere between an English "sh" and "h".
Learn monitoring, for free
Practical, vendor-neutral guides on uptime, SSL, alerting, and status pages. Informative first — useful whether or not you ever use Ensju.
What Is Uptime Monitoring? A Practical Guide
How the checks work, what you can watch, and how to set it up so you hear about an outage before your customers do.
Jul 8, 2026
The Low-Cost Homelab Monitoring Stack
Watch the whole rack — hosts, services, uplink, and backups — without opening a single port or signing up for a corporate budget.
Jul 1, 2026
Monitoring Cron Jobs & Workers with Heartbeats
The backup you think is running might not be. Here's how a dead man's switch catches the jobs that fail without making a sound.
Jun 30, 2026
Not ready to sign up? Get the monitoring playbook.
Practical, vendor-neutral tips on what to monitor and how to alert, the stuff we wish every team knew before something broke. Plus the occasional Ensju update. No spam, unsubscribe anytime.
Prefer it all in one place? Get the free Web Monitoring Playbook (PDF) →
Something you run will break. Be the first to know.
Free plan, no credit card. Add your first monitor before your coffee's gone cold.