How Ensju works
Two simple flows. No magic. No inbound ports.
Ensju watches your sites from a network of probes we run, and your servers via a small agent that calls us, never the other way around. Below is the actual shape of the system, in plain language. If you'd rather see the marketing pitch, the homepage has it.
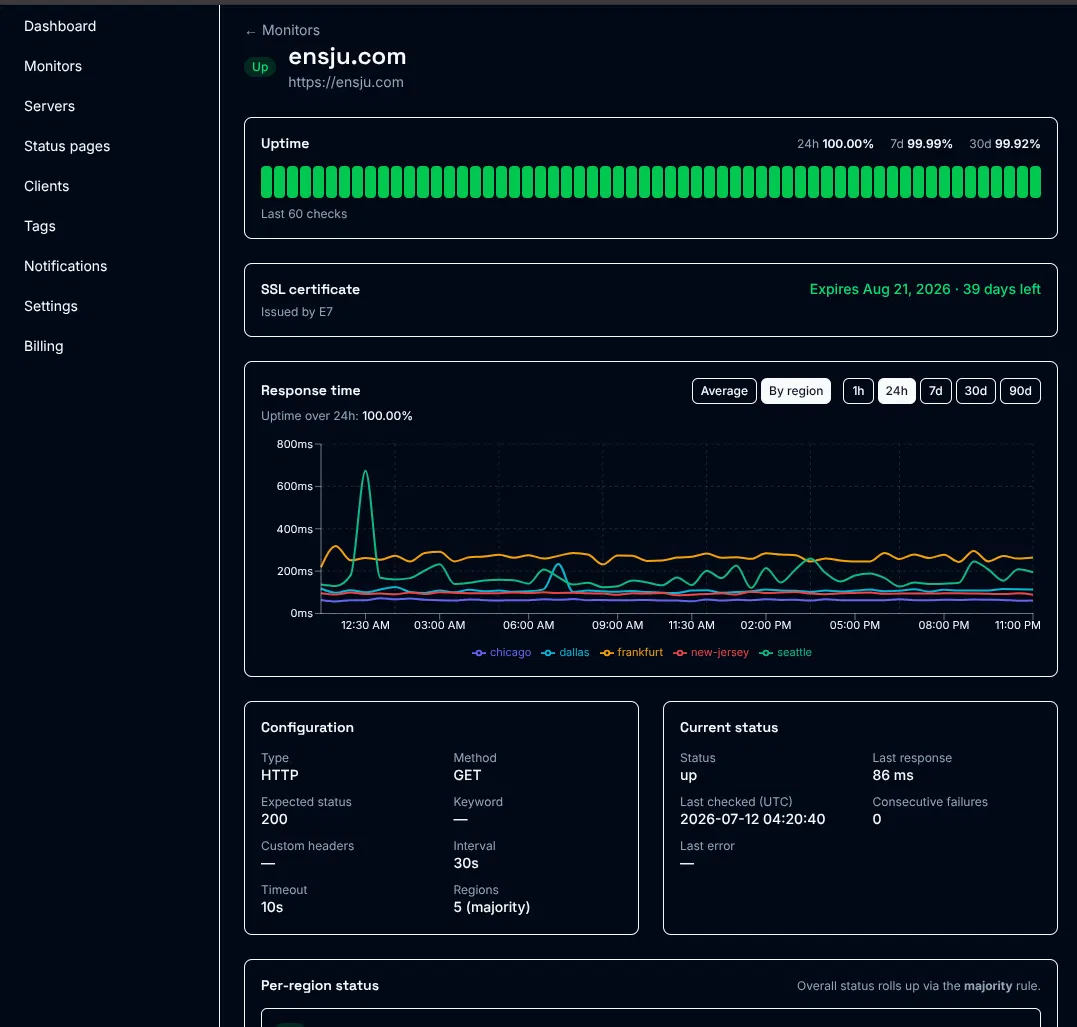
How an uptime check actually runs
You add a monitor: a URL, a TCP port, a DNS record, an ICMP target, or a Tor .onion address. From that moment, a worker in each region you picked starts running it on the interval you chose. Here's the loop:
- 1
Lease
There's no central scheduler pushing work out. Each region's worker polls our control plane over HTTPS and leases the checks that are due for its region. The lease is atomic, so two workers never run the same check, and a slow or offline region simply stops leasing without holding up any other region.
- 2
Probe
The regional worker (a tiny, stateless probe) executes the check: an HTTP GET, a TCP connect, a DNS resolve, an ICMP echo, or a Tor connection for .onion targets. It never touches our database. Every customer URL is resolved once and locked to that IP for the duration of the request, so DNS rebinding can't redirect a check at our own infrastructure.
- 3
Report
The worker posts the result back to our ingest endpoint over HTTPS, signed with a secret it shares with the control plane. Every result lands in a time-series store, partitioned by time so history stays fast to query.
- 4
Roll up
If the monitor is probed from multiple regions, your configured down-rule decides whether one region failing means the site is down or your network path is. The choices are any / all / majority / N-of-M. The overall status is what your dashboard and alerts see.
- 5
Alert (only on transitions)
A genuine state change (up → down, down → up, or an edge-triggered cert-expiry crossing) fans out to every channel you've routed to that monitor. A flapping monitor doesn't page you; the state machine debounces it.
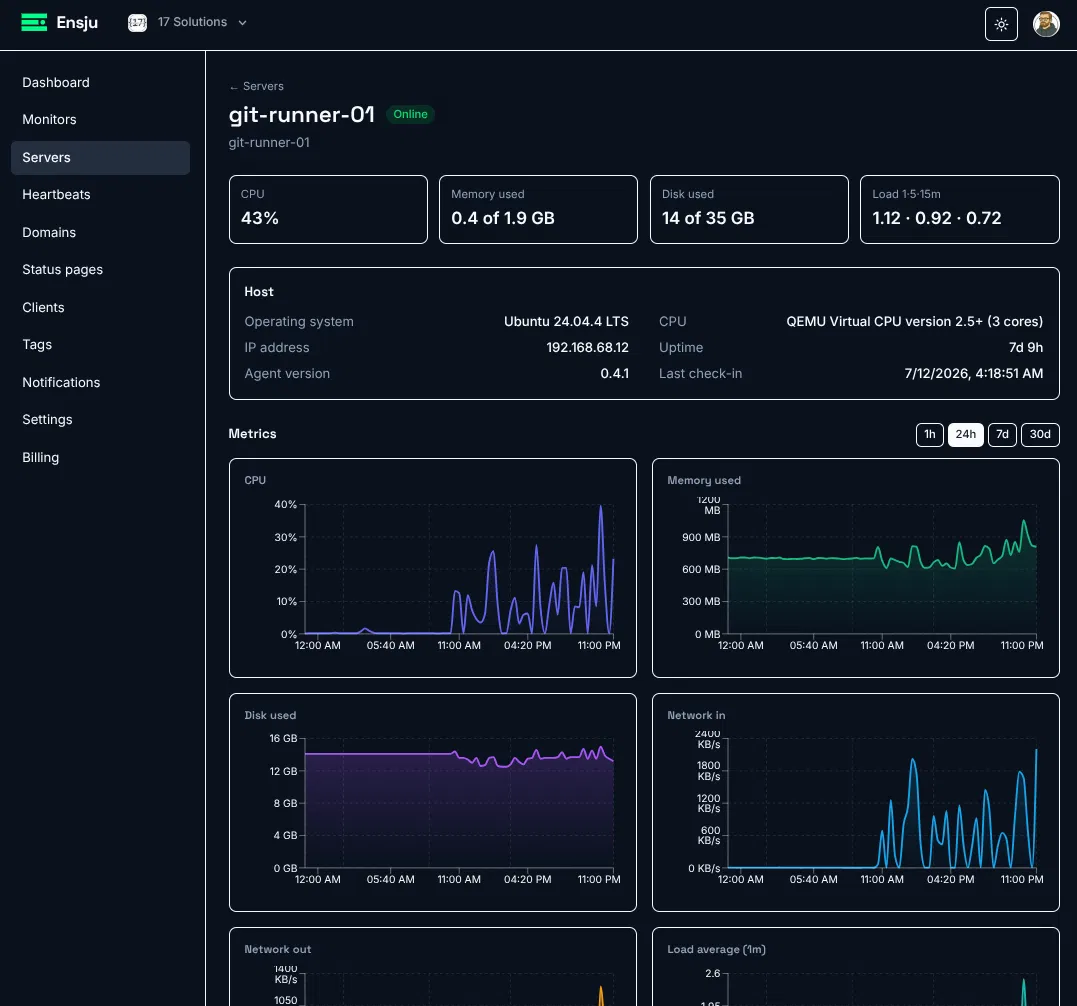
The agent calls us. Never the other way around.
This is the part most monitoring tools get wrong. Ensju's server agent is outbound-only, it never opens an inbound port, never accepts a connection, never asks you to forward anything through your firewall.
What the agent actually does
- Installs in one command, a one-liner from your server detail page drops a small binary and a background service that restarts on boot.
- Runs unprivileged: no root after install, no raw-socket privileges, no SSH access in, and no Docker access unless you opt into container reporting.
- Reads local system counters for CPU, memory, disk, network, load, and service health, nothing else.
- Posts metrics over HTTPS every ~60 seconds (cadence comes from your plan), authenticated with a per-server token we only ever store hashed.
- Goes through CGNAT, behind strict firewalls, on residential ISPs, wherever. If your server can reach an outbound HTTPS endpoint, the agent works.
- Uninstalls in one command. No background processes left behind. No data we keep that you didn't ask us to.
If our control plane disappeared tomorrow, your servers wouldn't even notice, the agent would just keep trying to POST and silently buffer recent samples until things came back.
The shape of it
Stateless probe workers in every region, each reaching the control plane over outbound-only HTTPS, they lease work and post results, and never accept an inbound connection themselves. The database never faces the public internet. A dispatcher fans alerts out to whatever channels you've connected.
You
Watch your sites, APIs, and servers from the web app or mobile companion; alerts reach you on email, Slack, Discord, and more.
Ensju
The Next.js app + lease endpoint hands due checks to stateless probe workers and stores results in an org-scoped time-series database.
Probe workers
One per region, they probe your sites over HTTPS / Tor and post signed results back, no database or queue port is exposed to the internet.
Your servers
The Ensju agent reports metrics outbound-only over token-authed HTTPS, so there's nothing inbound to open.
- Every business table is org-scoped. Each request runs locked to a single organization, and every query is filtered by its org id, so one customer's data never crosses into another's.
- The probe workers don't connect to your data plane at all. A worker only ever talks to two HTTPS endpoints (one to pick up the checks due in its region, one to hand back results), both locked behind a shared secret. It has no database access and only ever sees the checks it's actively running.
- Workers reach us, never the other way around. A region is just a VM making outbound HTTPS calls; it exposes no inbound ports, and there's no queue or database port anywhere on the public internet to scan or attack.
- The probe is the only thing that touches your URLs. All HTTP/TCP/DNS/ICMP dialing goes through an SSRF-safe blocklist that rejects RFC 1918, loopback, link-local, AWS metadata, and known-bad ranges before the connection opens. We'd rather refuse to probe a misconfigured monitor than ever probe somebody's private network from inside a customer's account.
How an alert gets to your phone
From the moment a probe reports a failure to the moment your phone buzzes is typically under five seconds. The path:
- 1. The ingest writes the result, runs the state machine, and decides whether this is a real state change vs. a transient blip (the down → up transition is immediate; up → down requires consecutive failures by default).
- 2. If it's a genuine transition, the dispatcher pulls every channel you've routed to this monitor (email, Slack, Discord, Telegram, Signal, and webhooks) and sends to each one independently. A failure delivering to one channel never blocks the others.
- 3. Email channels stay un-routed until the recipient has proven they control the address with a tokenized click, an unverified address never gets paged.
- 4. Every delivery is logged with status, error, and dispatch time, so a missed alert is a question you can answer rather than a question you have to guess at.
Your data is your data
Monitoring tools see a lot of your infrastructure. We treat that the way you'd want us to.
Your secrets are scrambled
The credentials you hand us (Slack tokens, bot tokens, webhook URLs) are encrypted with AES-256 before they're stored. Even someone holding the raw database can't read them.
Locked in transit
Everything that moves between you and us travels over an encrypted (TLS) connection: your browser, the agent, the dashboard, our probes. Nothing about your setup crosses the internet in the clear.
Your data is walled off
Your account's data is sealed off from every other account. Every request is locked to one organization and every database lookup is filtered by it, so you only ever see your own.
Server keys you control
Each server's key is shown once when you set it up. After that we keep only a one-way fingerprint. We literally can't recover the original. Want to cut a server off? Delete it.
We don't sell or snoop
You pay us, so we work for you, not advertisers. Your monitors, metrics, and logs are never sold, profiled, or fed to an ad network. Ever.
Backed up and recoverable
Your data is backed up every night to a separate off-site location, kept for 30 days, and we've tested restoring it. Releases ship as exact, pinned versions, and the big decisions are written down.
Add your first monitor in two minutes.
Free plan, no credit card. Ten monitors and a server agent are yours forever.